Spectra Table
When working with spectroscopic data, it's essential to have a way to name, organize and describe the spectra you're analyzing. This is where the concept of a Spectra Table comes into play. Think of it as a spreadsheet or a table where you can store and manage important information about each spectrum you have. You can easily access it using the Metadata Expand button in the lateral side of the Spectra table. For returning to standard layout, use the Metadata Collapse button.
Collapsed Spectra Table
The Collapsed Spectra Table is visible from each menu tab on the left side of the screen. It will show the name of every spectrum loaded in the workspace next to several options and information.
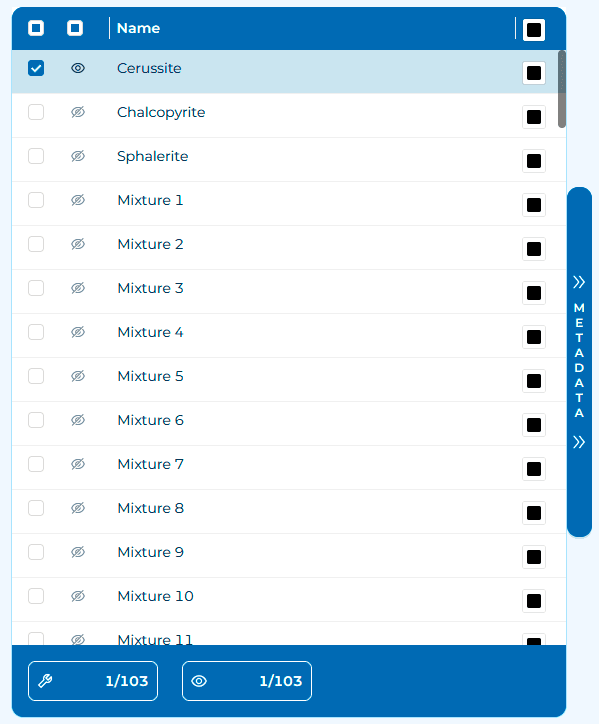
- Editing Check: The first checkbox. When a spectrum is selected, actions will be applied to it. Think of it as a "trigger safety button"; if it's not checked, the spectrum is loaded into the dataset but ignored for further operations.
- Visualizing Check: The second checkbox, the eye button. When working with large datasets, showing or hiding spectra can be crucial for optimizing software resources or comparing spectra. This is independent of the editing check.
- Number of editing-selected: At the bottom of the table, the wrench box will show the number of editing-selected spectra and the total number of spectra in the workspace.
- Number of visulizing-selected: At the bottom of the table, the eye box will show the number of visualizing-selected spectra and the total number of spectra in the workspace. Due to software optimization, the maximum number of visible spectra is 100.
- Metadata Expand button: On the side of the table, press it to access the extended spectra table where metadata can be managed.
Expandaded Spectra Table: Metadata
Metadata refers to additional information that describes and characterizes each spectrum. This can include details such as the date the spectrum was recorded, the type of sample or material being analyzed, the experimental conditions, or any other relevant information that can aid in the interpretation and analysis of the spectral data. It's essentially a spreadsheet with rows representing individual spectra and columns representing different metadata attributes.
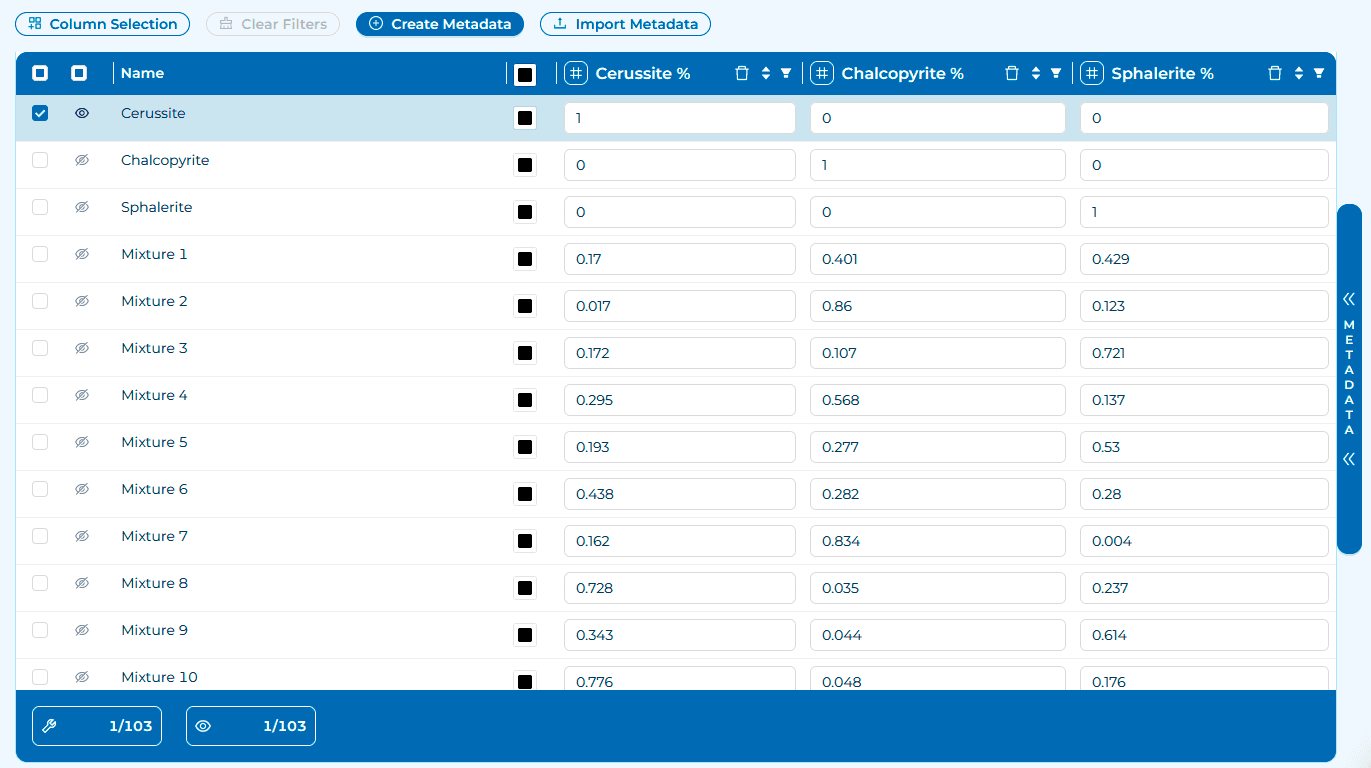
Adittionally to collapsed spectra table actions, you will gain access to metadata management.